By IE&M Research
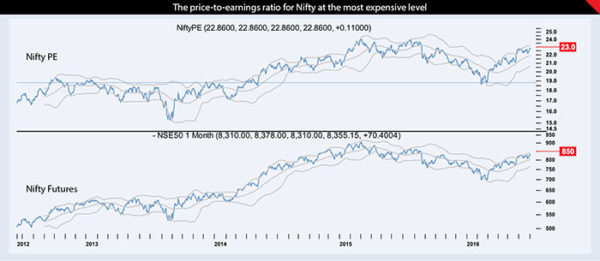
The stock market is relatively looking a tad expensive. The price-to-earnings ratio for equity index, Nifty, has increased recently and is near to the most expensive level in the last four years.
Even the US Fed thinks so. As part of Chair Janel Yellen’s testimony to the US Senate end June 2016, the Monetary Policy Report released by the Federal Reserve highlighted a worrying trend in the price of the stocks as reflected by major stock market gauge, the S&P 500 index.
The Price-to-earnings ratio for the Nifty index (based on the constituent companies’ earnings) has increased to 22.86, a kissing distance from the highest 24.06 in early 2015, a level well above two standard deviations from the long term median. At current levels, the Nifty index is trading about 9 percent below its all-time high and the PE is near the most expensive level in the last four years. Likewise, the Earnings Yield (price-to-dividend) is near the lowest levels. This moves in inverse relation to the PE as higher the price, the lower the returns on the same.
The Nifty is selling for 23 times last year’s reported earnings. If you bought the index at current price, you’d have to wait nearly a quarter-century before earnings – if they maintain current run rate – repaid your investment.
Just because the stocks are expensive on the PE ratio does 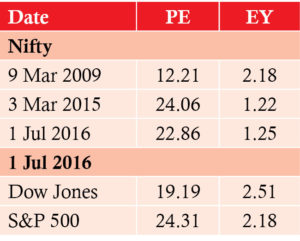 not necessarily mean that they will fall as they may still look attractive considering softening interest rates and upbeat economic outlook. If the economic data were not to match with the heightened growth expectations, the stock prices could fall triggering mean reversion in PE. Stocks are a forward-looking asset, so if the economic outlook is downbeat, it is likely that prices, and by extension the PE, would decline.
In essence, the price-earnings ratio indicates the rupee amount investors are willing to pay in order to receive one rupee of earnings. This is why the P/E is also referred to as the multiple. If a company were currently trading at a P/E multiple of 20, the interpretation is that an investor is willing to pay Rs 20 for Rs1 of current earnings.
This ratio, like many other metrics, has its own limitations and investors must not be led to believe that there is one single metric that will provide complete insight into an investment decision, which is virtually never the case.


