Exchange Traded Funds, new passive funds in the ring, are fueling stock indices to record highs as retail investors take SIPs route to building wealth.
By IE&M Research
Too much money is chasing too few stocks. Literally in Indian markets as investors have found a new and supposedly easy way to just “sit tight” and scoop profits from risk assets, courtesy fund managers propagating exchange traded funds (ETFs) over the last couple of years. It’s easy for money managers too, especially in a rising market. Many active funds, which employ professional fund managers who try to beat the market by having more discretion in choosing which securities make up a portfolio haven’t been able to beat the market, particularly in a downtrend.
The Rise of Passive Funds
Passive funds are the flavour of the season and have benefited from unprecedented central bank actions that have pumped trillions of dollar liquidity creating a very unusual market situation. With the cost of borrowing at record lows, valuations have become extremely distorted in the market. This careful balancing act by central banks benefits passive investors until it blows up.
The contrast is very glaring. While the benchmark indices, Nifty, and Sensex are flirting with record highs, more than two standard deviations from the long term average valuations, many stocks from the broader BSE-500 and other segments are hitting 52-week lows. Because most of the incremental investment surplus is piped to ETFs, which necessitated by mandate, has to be poured into a select index basket and no where else. Since index funds attract more money, index stocks hit the roof and they get still more funds because of this performance. This fire can go on, till it can’t go any further. Thus, the equity market is a study of contrasts now as on one side Nifty and BSE Sensex are scaling new highs, there are companies that are hitting their 52 week low and these are not companies only from ‘T’ or ‘Z’ group.
The other reason for such contrast is the emergence of domestic institutional investors (DIIs) as the dominant force in the equity market, whereas not long ago, Indian markets used to dance to the tune of FIIs and they were considered as the leading force behind the movement of equity market on either side. Nevertheless, as domestic funds are inundated with the funds through systematic investment plan (SIP) and retirement money, they are better positioned to support the market.
In this changed scenario the landscape of mutual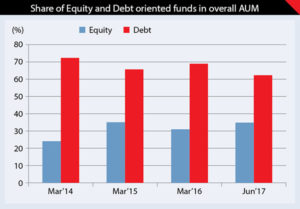 fund investment has radically changed in the last few years. If we scratch the surface and try to find where these funds are being deployed, most of the funds are finding their place in index or exchange traded funds (ETFs), especially the retirement money. The mandate of these funds is to invest in stocks that are part of the index. The money is invested according to the composition of the index on which the
  fund is based. For instance, an index fund tracking the Nifty 50 will invest in the Nifty 50 stocks, following the same allocation pattern as the index.
Most of the funds received by the index funds or ETFs are sticky and are long term in nature. Therefore, they do not have to keep a lot of cash in hand and moreover they have to track the index with minimum tracking error. Hence the funds that keep on pouring are continuously getting invested in index based stocks. This helps index based stocks to perform better than stocks that do not form part of the index.
This is the reason why we are witnessing the dichotomy in the equity market where some stocks are touching their life time high while others are languishing and hitting their 52 week low.
What is passive investment?
Passive investment strategy tracks a market-weighted index or portfolio. The most popular method is to imitate the performance of a specified index by buying an index fund. This is quite common, where index fund tracks a stock market index such as the BSE Sensex or Nifty, however, bonds, commodity market and hedge funds are also not aloof to this concept. They are popular because they give higher returns compared to similar fund with similar investments. They could achieve this because of lower turnover and lower management fees. On an average the expense ratio of ETFs is around 0.6% compared to around 2% for actively traded equity diversified fund. In terms of volatility too, historically ETFs has witnessed lower volatility compared to active funds. Hence, ETFs give better risk adjusted returns compared to similar active funds.
Steadily increasing its presence
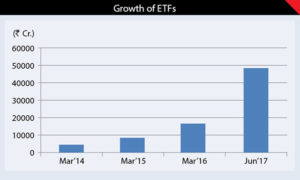
Passive investment largely represented by ETFs has witnessed a phenomenal rise in their AUM, albeit at a lower base. Within passive funds, equity ETFs account for 82% of total passive funds. If we talk of just equity ETFs (excluding gold ETFs, which in anyways are showing a declining trend), total AUM has increased by 10 folds since March 2014. Total AUM of ETFs, which was at around ` 4528.47 crore at the end of March 2014 now (June 2017) stands at staggering ` 48359.1 crore, recording an annual growth of 158%. This is way beyond the 40% growth witnessed by overall AUM. This phenomenal increase has helped ETFs to increase their share in overall AUM from lesser than 0.6% at the end of FY14 to 2.55% currently.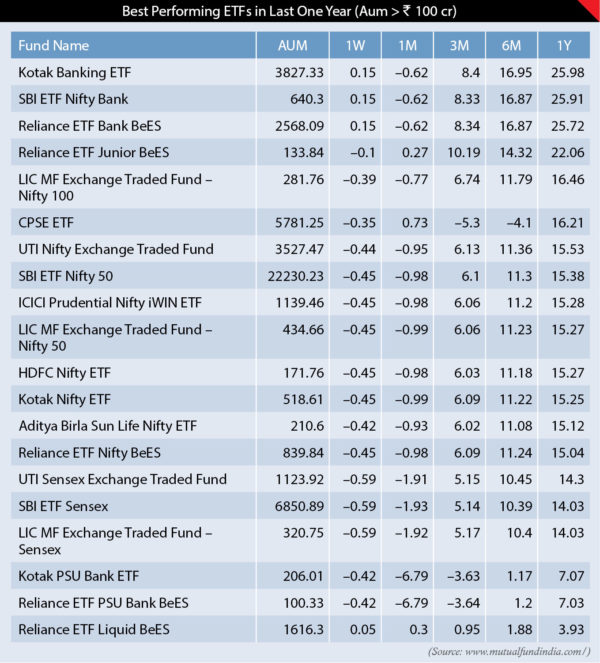
But, this is still quite low compared to a global average of double digit and in some developed countries like USA it is likely to take dominant positions by the end of 2018, when they will account for more than 50% of the entire asset under management, predicts Bernstein Research, a research company in USA. We believe that going ahead ETFs in India will do a catch up to a world average sooner than expected. Last three years data show that incremental flow to the ETFs is increasing as a percentage of the total flow to equity schemes. It has increased from below 6% at the end of March 2014 to 14% at the end of July 2017.
Factors that will fuel growth
The game changer is definitely an investment of pension funds in equity market through ETFs. They have the potential to become largest equity investor. Till a couple of years back, the Indian mutual fund industry could not get the retirement money, which is long-term in nature. But things have started changing with the Employees’ Provident Fund Organization (EPFO) allocating a portion of its incremental inflows into equity ETFs.
Investing in equity is a perfect fit with the long-term investment horizons associated with retirement planning, and helps boost the vesting corpus. EPFO started with allocating 5% of its incremental inflow of around ` one lakh crore in FY16 to equities, before increasing this to 10% in FY17, and now plans to use up its full quota allowed, which is 15%. This, along with the inflow from National Pension System (NPS), where a maximum of 50% is allowed to be invested in equity will help to attract more money into ETFs.
According to a report, on a combined basis, equity saving via these retirement funds could reach $170 billion by FY26. Besides, steps like government’s successful divestment of select Maharatna and Navratna PSUs through India’s first Central Public Sector Enterprises (CPSE) ETF will further help deepening of the product. All these developments point towards the boom of passive investment in India.
The eco-system needed for promotion and acceptance of such products among retail investors is evolving fast. In last two decades SEBI has introduced significant regulatory reforms pushing for a more transparent, investor-friendly and less risky mutual fund industry in India. GST is also expected to have a significant impact. Increasing financial literacy level and well regulated advisory level will help in acceptance of such products. However, advisory business is still commission based (as opposed to fee-based) and, therefore, advisors have less incentive to recommend ETFs.
Key Factors While Selecting Good ETF
Lower tracking error: Difference in returns between an ETF and its benchmark is known as a tracking error. Investors should look at consistently low tracking error over long periods of the scheme’s existence.
Impact Cost: Higher the liquidity, lower the impact cost and therefore lesser the indirect cost to investors. Liquid stocks have low impact cost. So, watch out for this cost.
Expense Ratio: The annual charges of an ETF are shown in its expense ratios. This includes fund expenses, including: management fees, administrative fees, operating costs and all other asset-based costs incurred. Lower the better.
Liquidity and historical track record: Monitoring the liquidity of an ETF is important, while an investment is made and it may be profitable, it is important to ensure that one is able to exit when they want to.
The possibilities
The Indian mutual fund industry is yet to mature in terms of product innovation and offerings required to promote passive investments. There is no dynamically managed indices or innovative indices. While there may be indices within the stock exchanges, these are not available for investing. The current number of ETFs is less than 50 with AUM of ` 53056 crore (August 27, 2017). While the number of index funds is even less (around 21) with lesser AUM (around ` 2500 crore). And most of these track either Nifty or Sensex. Asset Management companies are also not launching more ETFs or index funds, as they can generate alpha for their investors through their active funds. The reason active funds are generating superior returns compared to passive funds are because the Indian equity market is inefficient where information asymmetry exists. The fund manager takes advantage of such asymmetry helping them to generate alpha.
Nonetheless, evidence suggests that this alpha is getting reduced with every passing year and is especially true with large cap funds. Nonetheless, in case of small and mid-cap funds, active funds still have distinct advantages. However, as equity markets become mature and efficient, India too will follow the global trend where investors are increasingly moving out of active funds and switching to passive funds.
Five MF Schemes with Positive Alpha
(all returns are calculated as on 22nd August 2017)
L&T Emerging Businesses Fund
The performance of this fund has been 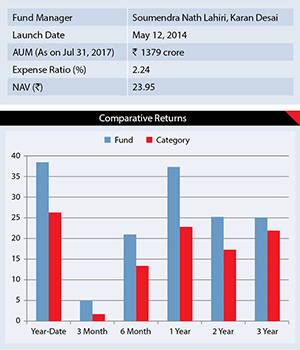
remarkable since its launch. The fund manager’s ability to identify early the theme that are going to play and investing in them has helped it remain in the top five performers in its category since its inception. Fund Manager attributes such performance to “bottom-up stock selection approach” and “focus of the portfolio is on those companies which are in the early stage of development and have the potential to grow their revenue and profits at a higher rate as compared to broader market”. Majority of the fund’s corpus is invested in small cap stocks.
These stocks are beyond top 200 companies, based on the market capitalisation as per major exchanges. At the end of July 2017, out of the total portfolio, 52% are small cap stocks while 48% mid cap stocks. In terms of stock selection strategy, the fund gives more weightage to those stocks that exhibit higher return on capital (ROC) compared to their peers, has a quality management and is available at a better valuation with an adequate margin of safety. This has helped the fund to generate positive alpha for its investors. Going ahead fund is likely to remain outperformer as in the current scenario, where earnings are expected to recover and grow significantly over the next few years, small and micro cap stocks, if chosen carefully could deliver significantly better performance.
Motilal Oswal MOSt Focused Multicap 35 Fund
This fund, which has some unique features, 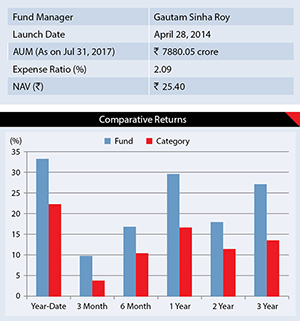
remains a top performer in the equity diversified fund space, never missing its place in its category since inception. The fund has been able to beat its benchmark and category returns by a huge margin in all time frames. To quantify the same, in last three years, it has generated a return of 27.14% annually, compared to 13.57% by its category. The benchmark return in the same period was mere 10.1%. The fund seeks to run a compact portfolio and can invest in a maximum of 35 high conviction stocks across market caps. However, currently it holds only 23 stocks in its portfolio. This may raise concern among investors about the risk associated with such concentrated portfolio. Nonetheless, we find standard deviation of the fund only marginally above its category average.
The reason for such contained volatility is the majority presence of large cap stocks in the portfolio, which are believed to exhibit lower volatility. Giant and large cap stocks form more than three fourth of the portfolio, while small and mid cap 23%. The stock selection strategy seems to be pure bottom-up stock picking. It moved away from top sector holdings such as Information Technology (IT) and pharma a year ago, to auto, energy and financials. Now portfolio is heavily tilted towards stocks from the financial sector, forming 47.27% of the portfolio.
SBI Small & Midcap Fund
SBI Small and Midcap Fund came into its
current 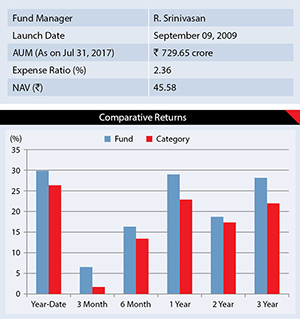 avatar in 2013 after SBI Mutual Fund acquired Daiwa Industry Leaders Fund. Since then, the fund has witnessed a quantum jump in its performance. In last three year period, the fund has generated annualized return of 28.14% against the category return of 21.97%. This astounding return has helped the fund to attract huge investments. The net assets, which was mere ` 12.53 crore at the end of 2013 has increased to ` 729 crore (31st July 2017).
As the name suggests, this fund is a pure play on small cap as they account for 64.27% of the total portfolio. The weightage of small cap in the fund is higher than the category average, which holds on around 47.35% of small cap stocks in their portfolio. Add to such higher weightage of small cap, running a tight portfolio-currently holding just 31 stocks, takes risk of the fund on higher side. Nonetheless, a better stock selection strategy has helped fund to contain risk.
The fund manager selects companies that exhibit sustainable competitive advantages, have higher return on capital, good management and which is available at reasonable valuations. The fund has kept a capacity constraint of ` 750 crore on its overall corpus hence it has stopped accepting fresh inflows, however, existing investors may continue to hold the fund looking at its outstanding performance.
Reliance Small Cap Fund
The Reliance Small Cap Fund has performed 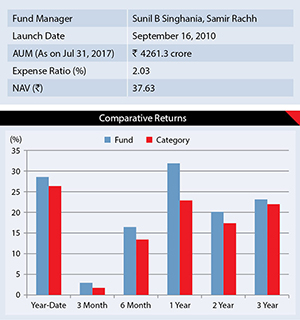
better than its benchmark since inception, staying at the top of the pack in both good as well as bad times. An investment of ` 10,000 at the launch of the fund would have yielded ` 39,077 (on Aug 24, 2017). The fund could achieve such feat by remaining ahead of the curve when it comes to selecting stocks. Credit goes to the fund manager and his team in identifying such companies for investment. Fund follows a bottom-up approach while undertaking its stock picking activity, and follows a blend (mix of value and growth) style of investing. The factors that are considered while selecting a stock are quality of management, scalability and sustainability of business and reasonable valuations. The same principle also helps them to design their exit strategy never refraining from selling when valuations look over-stretched. This is the reason the turnover of the fund is higher than the median turnover of its category. The current portfolio of the fund is highly diversified and contains 80 stocks, which is way above the category average. Small cap accounts for 70% of the portfolio against the fund’s mandate to invest 65%. Mid-cap shares constitute 26% of total portfolio. In terms of sector weights, Chemical sector stocks dominate with 18.55%, Engineering and FMCG are other two sectors that form part of the top three sectors.
Mirae Asset Emerging Bluechip Fund
Bluechip companies are generally associated 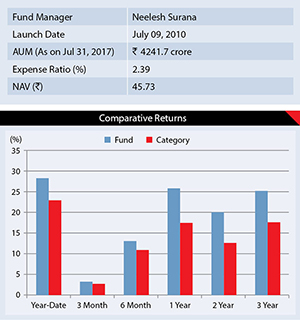
with large cap stocks. Therefore, investors may find it strange that Mirae Asset Emerging Bluechip fund, which is a mid-cap dedicated fund, is having bluechip attached to it. The reason is fund manager’s steady focus on quality companies operating in mid cap space. Fund Manager Neelesh Surana explains his investment strategy as “endeavor is to invest in high quality growth businesses, where the management has been efficient in allocation of capital and has vision to grow the business.” These investment strategies has helped the fund to beat its category and benchmark constantly. Year till date (August 22, 2017), the return generated by the fund is 28.24% compared to 22.9% by category. In the past few months the scheme has invested in certain companies that have not generated decent returns and hence the overall performance has fallen down in comparison to its category. Nonetheless, the fund has been able to generate a much higher return compared to the risk taken by the scheme. It is clearly reflected in Sharpe Ratio of 1.66, which remains one of the highest among its category. The portfolio allocation shows a consistent 40-60% allocation to mid-caps and a 20-40% to large caps. Currently mid cap allocation stands at 54.13%, while the large cap accounts for around 33%. In terms of sector weightage, financials carry a higher weightage with 23.17%.
MF assets hit new high
According to the data released by the
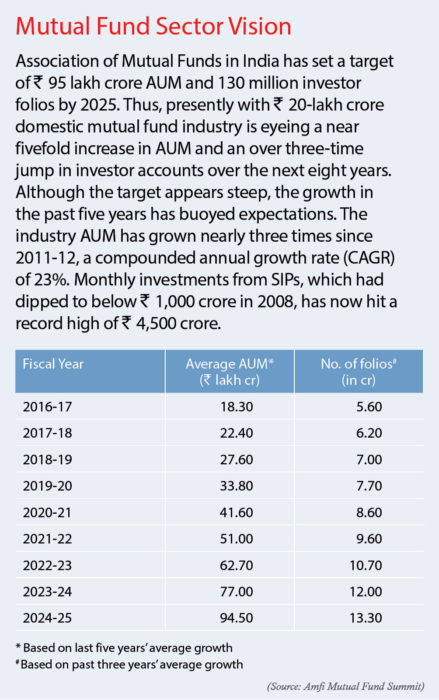
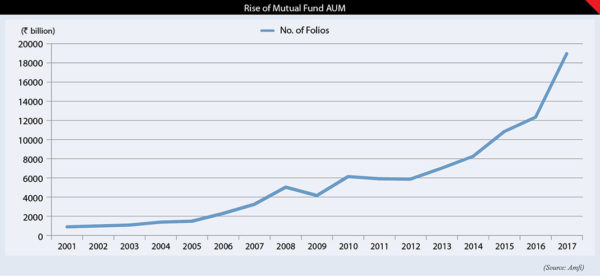
Association of Mutual Funds in India mutual fund industry’s asset base rose 7% to an all-time high of about ` 19.5 lakh crore at the end of the June quarter, driven largely by strong participation from retail investors. The industry assets under management was at ` 18.3 lakh crore in the preceding March quarter. Axis Mutual Fund stormed into the top 10 fund houses with AUM of ` 63,599 crore on the back of high inflows. Of the 42 fund houses, as many as 35 MFs witnessed growth in their asset bases, while five saw decline. ICICI Prudential MF continued to be the largest with AUM of ` 2.60 lakh crore (excluding fund of funds) followed by HDFC MF (` 2.53 lakh crore), Reliance MF (` 2.23 lakh crore), Birla Sun Life MF (` 2.05 lakh crore) and SBI MF (` 1.68 lakh crore). The benchmark Sensex on the BSE gained 3 per cent to 30,922 from 29,918 in the June quarter. The industry’s AUM had crossed ` 10 lakh crore in May 2014. It had crossed ` 20 lakh crore last month but gave up much of the gains due to economic uncertainty.


