By IE&M Research
The higher global equity and bond prices climb, the more vulnerable they become to a major fall. But it’s difficult to predict what could likely trigger such a setback. Stock markets are gloriously unpredictable. The only likely element is that the exact crash catalyst and its timing won’t be forecast by anyone.However, the importance of some of the traditional valuation parameters can’t be denied like the Price-to-Earnings Ratio (P/E ratio or earnings multiple), Price-to-Book Ratio (or P/B ratio), Debt-Equity, Free Cash Flow and the price/earnings to growth ratio (or PEG ratio). But when it comes to investing, ratios aren’t everything.Right now most of the above have been continuously giving mixed signals, making the investors nervous. As India has entered into an age of disruptions at several fronts, Indian Economy & Market with a deep analysis finds that there is certainly no danger lurks beneath the surface.
After a smooth journey for almost a year when the Nifty hit a rough patch last month the markets witnessed a scramble all around. There are various reasons attributed for such volatility. Primary among them are spillover of slowdown in GDP growth and geopolitical concerns. Nevertheless, what has also led to such correction in the markets is the concern about the valuation. Many believe that it has become over-valued in terms of some of the traditional valuation parameters – most important of them is price to earnings (PE) ratio. It is just 8% below its peak valuations reached during the fag end of 2007 and start of 2008. Markets also saw a sharp downturn from the same level during 2010.
Hence, the investors are feeling nervous at this point – Is there a danger lurks beneath the surface? Whether the markets are staring at a deep cut as experienced earlier at such valuations?
To answer these questions, a proper and deep analysis of the current PE is required in comparison to its historical performance.
Valuations on different parameters!
The Nifty is currently trading at trailing PE of 26x, which is actually two standard deviation above its long term average of 19.02x (since 1999). In simple words Nifty is currently trading at valuation, which it has traded only 2.5% time in last 18 years. Even if we take PE on the basis of consensus earnings of FY18E, it is currently trading at a forward PE of almost 19 times compared to long term average of 14.7x.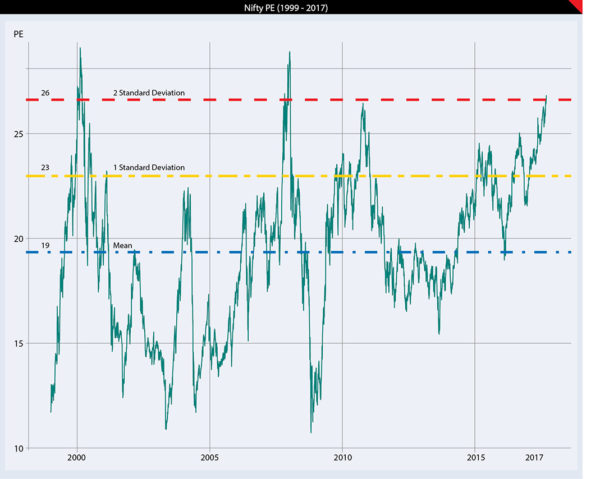
In addition to its own past, if we compare current valuation (PE) of Indian market with other emerging market (EM) peers, it is again trading at a premium to its long term average. MSCI India PE has always traded premium to its EM peers. The average premium for last 10 years has remained at around 37 %. However, it is currently trading at a premium of 43 %. The above comparison point out that the Indian equity markets is over valued and it might record a fall. Nevertheless, there are various factors that hints the peak is still away and the present higher PE need to be understood in the right perspective.
The current PE is based on low cycle corporate earnings
The growth in earnings of Nifty companies in the last five years can only be best described as anemic. It has grown at a CAGR of around 4%. The recent quarterly results too are not encouraging either. The reason for lower growth in earnings in the last few quarters is clearly attributable to demonetisation and implementation of Goods and Services Tax (GST). What has also played a spoilsport in earnings recovery is the spike in non-performing assets (NPA). Nevertheless, corporate earnings growth is likely to recover from the second half of FY18, once the impact of GST and the addition of NPA starts to decline. Hence, under all circumstances, earnings growth would catch up with the high PE.
Business cycles make PE in shorter duration misleading
The PE regularly reported is based on trailing twelve-month (TTM) earnings per share (EPS). During the peak of business cycles, companies report higher margins, better profitability and earnings, hence normal PE will be low. This will send a buy signal purely on a PE basis. The opposite is true when the business cycle is at its bottom. The earnings will be depressed as business is not doing well and margins are low. Hence PE will be higher and might give a sell signal.
Therefore, long term investors choose different valuation parameter to correctly predict market movement based on current valuation. One such parameter is Shiller PE, developed by Robert Shiller, winner of the Nobel Prize for Economics in 2013. This adjusts PE for the fluctuations in the business cycle and uses real per-share earnings over a 10-year period. This is also known as cyclically adjusted PE (CAPE) ratio, which gives a better signal of valuations during turning points in business cycles. The current output gap in the Indian economy coupled with low capacity utilization and stagnating earnings growth for a prolonged period clearly shows a bottom of the business cycle and hence the current PE ratio is most likely overstating the risk of growth faltering. Nonetheless, given the ‘low base effect’ prospects of revival in the earnings cycle going ahead is definitely more. The consensus estimates of Nifty EPS for FY18E is `476 whereas for FY19E it is `568 indicating a growth of 8% and 21% respectively on a yearly basis.
How is CAPE ratio placed now with regard to Nifty valuation? It is currently at around 21.9x, which is again higher compared to its long term mean of around 20x but within the tolerable range of 0.5 standard deviation. Therefore, according to CAPE, the market is not over-heated as of now.
Fewer stocks have led to higher valuation
The valuation of Nifty might be at the kissing distance of its all-time high, however, there are handful companies that have helped Nifty to scale such height and therefore led to higher valuation. Top five companies have accounted for 40% of growth in Nifty in last one year. Prominent among them are Reliance Industries and HDFC Bank. They together, share quarter of Nifty growth in last one year and have given a return of 76% and 57% respectively. Most of growth in share prices has come from PE expansion rather than the earnings growth. These are companies with giant market cap. Nonetheless, there are companies like Indiabulls Housing Finance that have doubled in last one year and 80% of this growth is due to increase in PE. All these have led to higher PE.
Against this there are companies in Nifty that are trading near their 52-week lows. These companies are primarily from Pharmaceutical, PSU Banks and IT sector. Hence, we believe that, though valuation is high on aggregate basis, not all companies are trading expensive. And as business activity picks up, in all likelihood there will be growth in earnings and normalization of PE.
Difference between bond yield and earnings yield still shows equity attractive
While doing equity valuation, future earnings are discounted by long term, 10-year yield on Government bonds, plus the equity risk premium. Therefore, low bond yields led to high PE ratio and higher valuation. In Indian context, whenever the difference between earnings yield (one by PE ratio) and bond yield dropped below 250 basis points,
money has shifted from debt to equity. Currently, the earnings yield is at 4.16% (after the recent drop in the market) and 10-year bond yield is 6.6%. The difference comes out to be 2.44%. Hence, we do feel that the valuation is at a dangerously higher level
and there is still a possibility of Nifty to go higher rather than falling. Although inflation has inched up in the month of August 2017 (3.1%), it is still well within the RBI’s target of 2-6%. Hence, inflation under control there is scope of rate cut by RBI, this difference will continue to come down and make equity investment more attractive and such higher valuation looks sustainable with more flows coming to equity.
Macro-economic factors do not look to be overheated
The current macro-economic factors, when compared to 2008 when markets witnessed a sharp fall, don’t indicate any serious concern. Factors such as credit growth and inflation appear to be at cyclical lows. Housing affordability is the best in decades and a housing boom appears imminent. Moreover, many of the path breaking reforms initiated by the government are yet to play out, which will give impetus for higher growth and for longer time. The political stability, important for visibility of policy continuation, also looks good at current juncture.
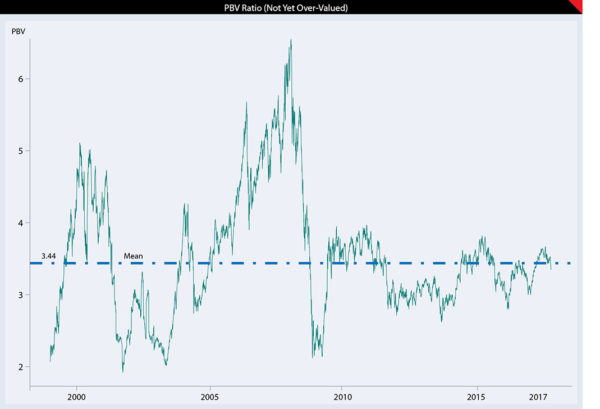
In all probability, it’s only the PE ratio that is higher (due to the factors mentioned above) and other valuation metrics, like price to book value (PBV) and dividend yield, seem to be at median of last 18 years. Currently PBV for Nifty is 3.35x against last 18 years average of 3.44x and maximum of 6.55x it reached during 2008. When earnings are depressed, PBV gives better picture on future returns.
Thus, there are not sufficient reasons for a sharp correction in the markets from current levels, and there also is not an iota of doubt this time it is really different. Therefore, current volatility should be used by investors to add positions in a staggered manner rather than selling
Higher PE is supported by inflows
Higher valuation of the market in terms of PE is primarily supported by institutional inflows. There is a significant correlation between markets multiple (PE) and inflows from the institution. Since early January 2015, FIIs and MFs have together pumped in `2.6 lakh crore in the Indian equity market. If inflows from the pension funds are added, this figure will become even larger.
These flows are critical to sustain current valuations, till earnings start to stage a recovery. According to a study done by CLSA, market return is positive if monthly inflows are 0.05% of free float market cap or more. The study further states that at current settings monthly inflows of 0.05% translate into USD400 million. Looking at the recent trends where domestic mutual funds are investing USD13 billion every year (in the last three years), FIIs are investing USD10 billion every year (last five years) and adjusting these figures for mutual fund dividends (USD1.5 billion/year) and continued insurance selling of USD2 billion, inflows of USD400 million every month is entirely possible. Sticky SIP inflows have alone crossed USD600million per month. According to the latest data, investment through the systematic investment plan (SIP) route touched a new high of `5,206 crore (USD800 million) in August.
Therefore, purely based on inflows, a double-digit market return is still likely from here on. The only caveat to this is a reversal of FIIs inflows and higher issuance of capital by Indian companies may make the 0.05 % fall short.
What can spoil the party?
Markets have scaled new highs despite the earnings cut in the last couple of years. Various coherent reasons such as bad monsoon in FY16, demonetisaion in FY17 and GST in FY18 has been assigned for such cut on earnings. Nonetheless, it cannot continue and next round of earnings cut may trigger a fall in the market. There are various factors that possess a threat to earnings growth. Geopolitics remain uncertain and despite not directly involved in the dispute, India would not be immune to global flows.
Mishandling of bankruptcy of large corporate accounts might create risks of contagion and environment of risk aversion. Till now farm loan waivers worth USD 20billion so far has not dented the market performance and the central government has stayed away from populist economic policies. But one cannot rule out the possibility of a populist measure looking at general elections in 2019. This might impact government finances and can affect equity market. Another key risk to the market is the potential reversal of FII flows. If the US Fed actually tapered their balance sheet sufficiently, it would be negative for equities worldwide impacting flows in India.


