CreditAccess Grameen Ltd.
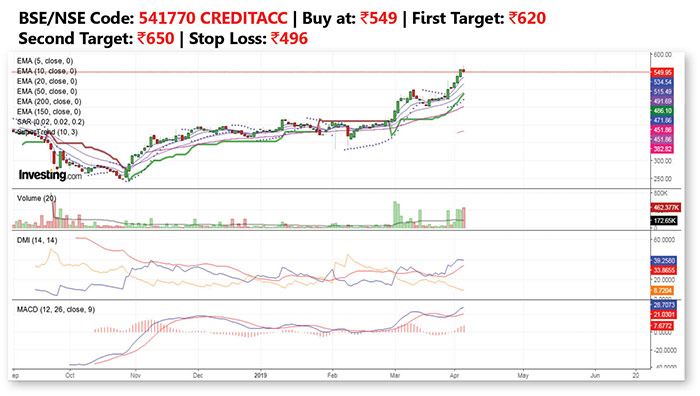
CreditAccess Grameen Ltd. is currently trading at Rs549. The 52 week high/low for the stock are 567/242.05 respectively. The stock formed yearly high on 04/04/2019. The stock is in uptrend move since it made a low of Rs242.05 in October 2018. The stock is trading well above its 5, 10, 20, 50, 100 and 200 simple and exponential moving averages on daily chart and 5, 10, 20 simple and exponential moving averages on weekly chart. Coming to indicators the ADX, MACD, Supertrend and Parabolic Sar have all triggered a buy signal on daily chart. The ADX, Parabolic Sar and Supertrend have triggered a buy on weekly chart as well. We recommend buying the stock at Rs549 with targets of Rs620 and Rs650 achievable within the next 30 to 45 sessions respectively using a stop loss of Rs496.
 Varroc Engineering Ltd.
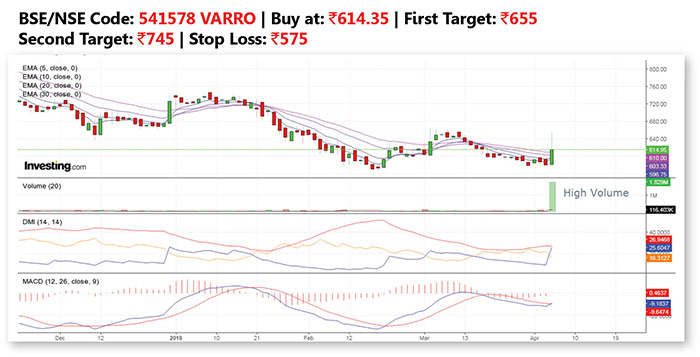
Varroc Engineering Ltd. is currently trading at Rs614.35. The 52 week high/low for the stock are 1178.70/565.25 respectively. The stock formed yearly high on 03/09/2018 and started falling gradually and made double bottom in the price range of Rs565-580. The stock is turning up and is trading at 6% high above the previous lows and trading well above its simple and exponential moving averages 5, 10, 15 and 20 moving averages on daily chart. Coming to indicators the ADX, MACD and Parabolic Sar have all triggered a buy signal on daily chart and MACD have triggered a buy on weekly chart. We recommend buying the stock at Rs614.35 with targets of Rs655 and Rs745 achievable within the next 30 to 45 sessions respectively using a stop loss of Rs575.


