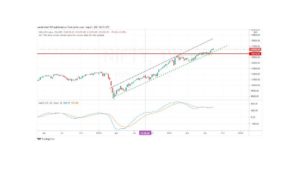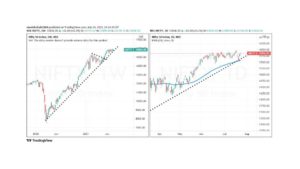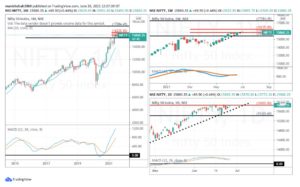


The pane on the left is the weekly price action in Nifty. Nifty closed the week in marginally negative. The decline was not severe as other equity markets in the world have seen. The loss for the week was only 0.98 % or 145 points.
The previous week’s long green candle was not supported by further buying interest during the week. As we see on the charts the rising trendline holds for the moment at least. This trendline support is enhanced by a 20-week average. Nifty continues to hold above the crucial support levels.
The prolonged sideways action in Nifty continues. Nifty needs to break above 15000-15050 for the index to see any further rally to continue. We have been of the opinion that there is a substantial barrier to Nifty at 15000-15050. The contraction in volatility is palpable and sooner or later the rubber band will snap and a smooth transition will then happen.

Daily Time Frame
On the daily time frame ( right pane) Nifty has seen a decline in the last two days. The 20-period moving average is now poised at 14629 and Nifty just made a low touching this moving average. Also, recall that on the weekly time frame Nifty has also hit a rising 20-period average. Secondly, a rising trendline that is coming up from March 2020 lows is also touching Nifty at current levels. Nifty is also making a pattern of rising lows suggesting that supports at shifting higher.
Time Cycles
Nifty is regularly making a low to a low cycle of around 15-20 trading days. We are currently 15 days from the low of April 24, 2021. Most likely Nifty should be making a low within the next 1-2 days followed by at least 6-8 days of the rally.
Probability favors that whenever a break happens it will be on the upside. As long as 14250-14300 we still assume that the longer-term trend is intact. For the coming week a break above 14850 would mean that Nifty will again attempt to move above 15000-15050 and if break out does manifest Nifty should rally towards 15450-15500. Any decline to 14450-14500 should be used to buy into the market with a stop below 14200. The potential for a big rally above 15000-15050 is huge considering the pattern in play.
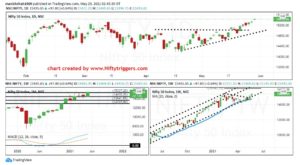
CNX FMCG
The sector that we have picked for alongside play is the FMCG sector. Results of most FMG stocks have been good to create but it is the thrust seen in the last two weeks that is a tell-tale sign of the rally ahead.
Weekly Time Frame
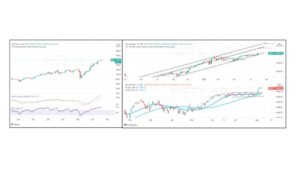
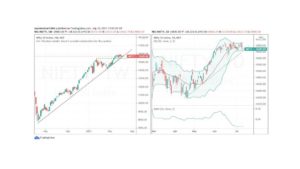
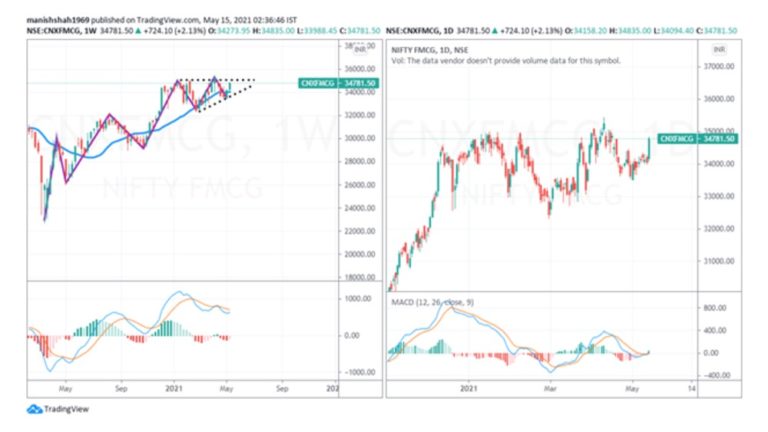
On the weekly Time frame (left pane) we see that the CNX FMCG chart is showing a pattern of higher highs and higher lows suggesting that the uptrend is pretty much intact. The sector chart shows it is trading above its 2018 highs of 33100. In the last two weeks, the sector has edged higher and the consolidation phase is taking the form of an ascending triangle on the weekly time frame. If the price does break out of this consolidation pattern we should see the index moving higher from current levels.

Daily time frame
On the daily time frame( right pane) we see the price moving higher in the last two weeks. For the week the price action was bullish as we see a long green candle that closed at the highs of the day. The range expansion candle suggests that bulls were active in this sector.
CNX FMCG Index is currently below its major resistance zone at 35100-35400 With the index closing at 34734 there seems to be some more room for the index to move up. The key is whether the sector index manages to move above 35100-35150 and holds beyond this zone for a couple of days. MACD is showing a zero line reject; a pattern where the indicator bounces off very near to the zero lines.
FMCG sector is likely to see a rally from current levels of 34800 to around 36200 and 36500 over the next several weeks. Traders should watch out for a buying opportunity in good quality stocks in the sector.