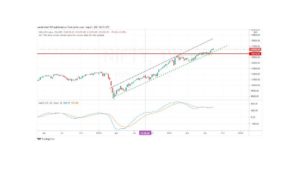





Nifty closed the week at 15490 a gain of 1.72 percent over the close of the previous week. We have only one day to go before the monthly candle for the month of May is completed. It makes sense to start from the monthly charts.
NIFTY Monthly Time Frame
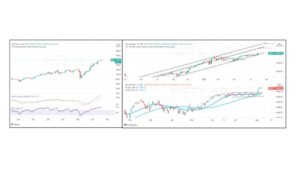
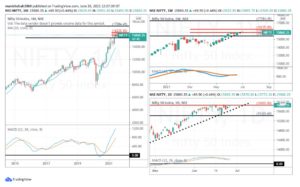
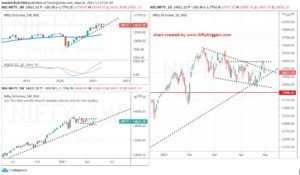
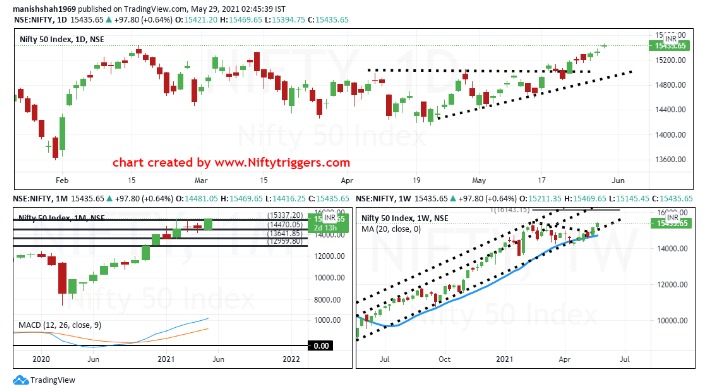
On the monthly time (bottom-left chart) frame Nifty shows a wide range candle that is closing at the high of the month (remember we have one day to go before the month closes officially). It is a wide range candle that is closing at the high of the candle and this is a bullish development. MACD is in a buy mode. The monthly candle also seems to be closing above 15337. This paves way for more upsides to 16000+ levels over the next couple of months. Over the long term, we should be rallying towards 17200 over the next several months.
NIFTY Weekly Time Frame
On the weekly time frame (bottom-left chart) Nifty closed above the resistance at 15430 and it is now moving higher. Note the parallel trendline and rising moving average offering support on declines. On the way up Nifty has violated the falling trendline giving us a trend continuation buy signal. Fibonacci Extension grid points towards a continuation of the rally towards 16143-16200 in the near term and possibly to 17200 over a couple of months. Overhead channel lines also point out towards 16143-16200 and higher.
NIFTY Daily Time frame
On the daily time frame (top pane) Nifty saw a breakout of an ascending triangle and this was a very positive development for the index. Other broad-based indices like Nifty200 and Nifty 500 are also in a firm-up trend. With the banking and financial services sector moving higher and of course Reliance, Nifty should move at a faster clip. Nifty still needs to hold above 15540-15500 for the breakout to get confirmed. Any decline to 15200-15300 should be used as buying opportunities.
Nifty should not see a break below 15050-15000 under any circumstances. If this happens then the breakout is questionable and this would give rise to a possibility of prolonged range bound action within 14200-15500. The probability of the Nifty moving higher over time is higher as world equity indices are on a roll.
The preferred trade on the long side with max stops below 15000 to allow for minor fluctuations to play out.
Bank NIFTY
The chosen sector for analysis for the fortnight is Bank Nifty.
In the last couple of days, Bank Nifty saw a reversal in fortunes. The rally in the sector index was relatively late considering the quality of results that were displayed by the players in the sector.
Bank NIFTY Monthly Charts
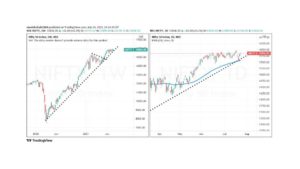
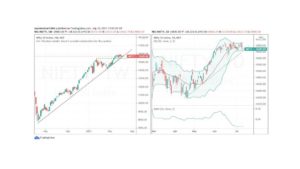
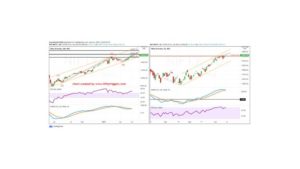
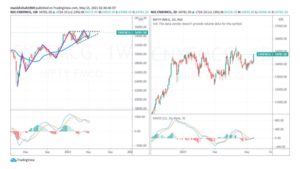
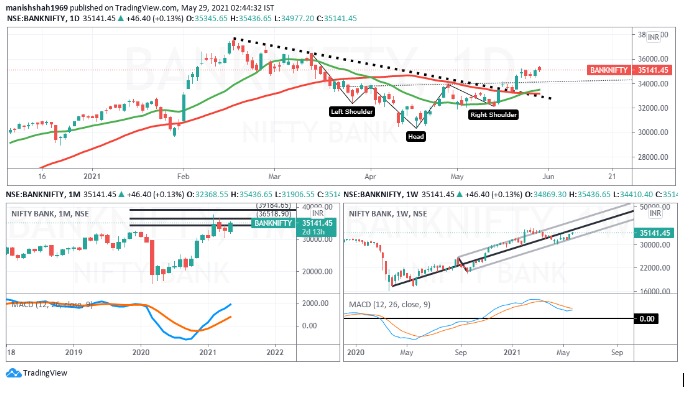
On the monthly charts (bottom left pane) Bank Nifty seems to be getting ready for more upsides as we see a wide-ranged candle that has closed at the highs. This is a trend continuation signal and it suggests more upsides in the months to come.
The expansion zones on the price charts indicate a rally towards 36800 and beyond that to 39400 in the weeks to come.
Bank NIFTY Weekly Charts
The weekly time frame (bottom left pane) shows a positive change in sentiment over last couple of weeks as green candles are dominating the landscape. A rising median line offers support to the prices as we see a steady up move along the lines. MACD Line shows a hook up which should mean a positive change.
Bank NIFTY Daily Time Frame
On the daily time frame (top pane) we see price breaking out of an inverse head and shoulder pattern which is a sign of trend reversal. We also see a golden cross of the moving averages and this is a big positive for Bank Nifty.
By applying multiple time frames we get a perspective that Bank Nifty is on the verge of a substantial and sustained rally over the next several months. The result session has been very kind to banking stocks and going forward the outlook for banking stocks seems to be favorable.
A rally in Bank Nifty towards 36800 and above that to 39400 over the next 8-12weeks is a possibility and at current levels Banking stocks offer a great reward to risk ratio as we are likely to see a new leg of up move. As long as the prior swing low of 32370 is intact Bank Nifty is in a firm grip.