


Nifty
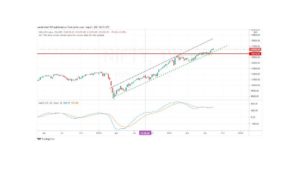
Nifty closed the week with a gain of 129 points. The highlight for the week was a strong bounce off the lows at 15550. Nifty has seen consecutive long-ranged candles for the last four weeks and thus we could see a pause in the current rally.
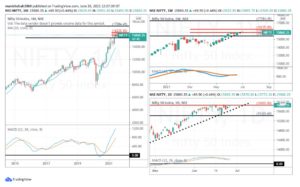
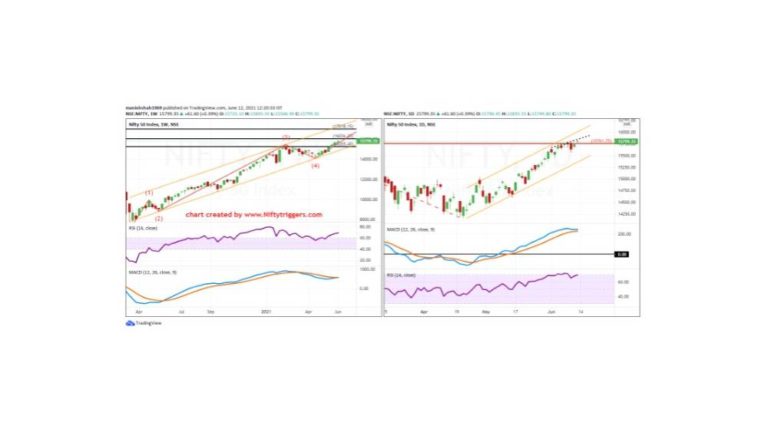
Price action on the weekly time frame shows a possible negative divergence forming on the price chart, suggesting that the momentum is slowing. In fact, MACD has crossed the above signal lien which has given a buy signal. So the longer-term trend has turned up and maybe the RSI divergence signal needs to be ignored or given secondary importance.
The MACD buy signal does suggest that Nifty is likely to see a rally but there could be a pause and ultimately the top line of the channel is the possible target; which may or may not be exceeded.
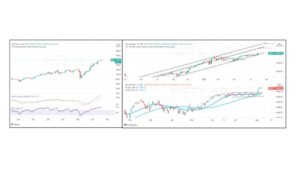
On the daily time frame (right pane) we see price in an overbought zone on the RSI and there is a small 4-6 bar divergence. Nifty is hovering around the projected resistance at 15760-15800. The signal line on the MACD has flattened out. Friday’s candle was a Doji and Nifty failed to break convincingly past 15750 that was the previous high.
The longer-term trend is up and we are looking at a possibility of a short-term corrective decline. A break below 15700-15725 could result in a 4-8 day decline to 15600, and below that to 15400. We want to be a buyer on declines as the trend in the market and in a declining market buy on declines should be the preferred strategy.

Nifty Metal Index
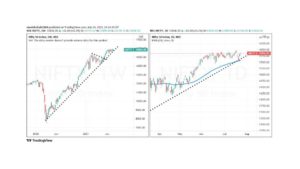
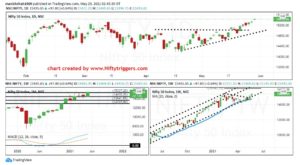
Our choice of sector index is the Metal sector. The metals sector is on a song with a very bullish momentum on the weekly charts (left pane). The pause in the trend in the last 3-4 weeks is just a pause and it was a time-wise correction. In fact, it is a candlestick bullish rising three methods pattern which is a trend continuation pattern. The pattern is taking shape below the horizontal resistance line. A bullish candlestick continuation pattern in a strongly trending market on the weekly is a sign of more upsides.
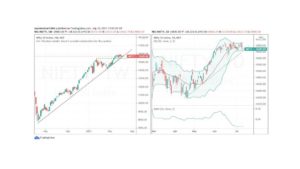
On the daily price chart (right pane) price shows a break out of a falling trend line and this is a bullish sign. MACD turns/hooks up and the price regains strength above its 20 period moving average.
Most people had written off the Metals sector but price action suggests a renewal of the uptrend. If the Metal index moves above 5450 and beyond we should see renewed buying interest for a rally to 5900-6000 over the next couple of weeks. Traders should keep stocks in the metal sector on their watch list for trading opportunities on the long side.