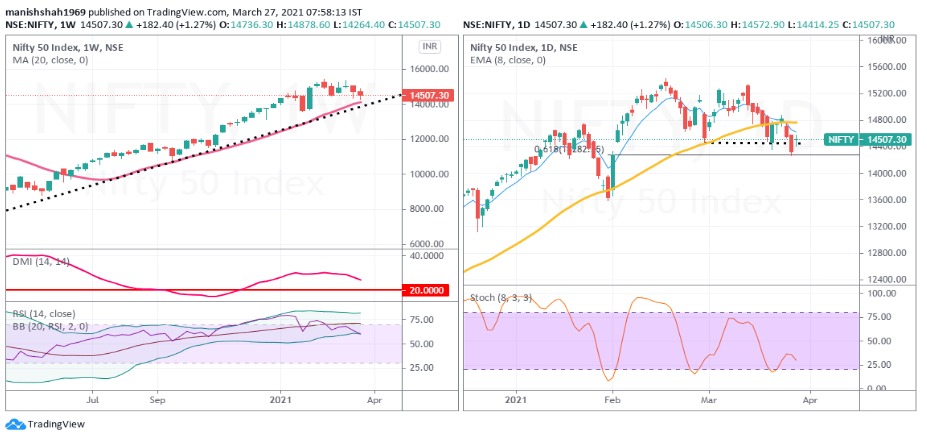
Nifty closed the week with a mild loss of around 1.61% over the close of the previous week. On the chart right pane is a weekly time frame and the left pane is the daily time frame.
A deep analysis of Nifty on the weekly time frame (left pane) shows a reading of above 20 on the ADX on the weekly time frame which means that the underlying trend in Nifty is classified as a strong trend. A rising trend line and rising support from the moving averages show a major support zone between 13600-13800. As long as 13600 (pre-budget low) is intact the trend is assumed to be up and the current decline should be used as buying opportunities.
A reading of momentum oscillator RSI and Bollinger band on RSI shows a relatively oversold reading. This means that in a strongly trending environment Nifty is oversold on a relative basis.
Daily Time Frame
The pattern on the daily is a “Harami Cross”. This is a bullish candlestick reversal pattern. The stochastic oscillator shows a positive divergence and this could be a sign that the index is bottoming out. Overnight the international markets especially the US markets have recovered and sharply. Even Asian markets which were relatively subdued in the last couple of weeks have shown a rally in the last two days.
For Nifty to move higher it needs to move and close above 14775-14800 which is the 50 periods moving average. Once Nifty closes above this zone further upsides to 15250 should be the target zone. A break below 14230-14250 would mean a decline towards 13600- 13700. As the overall trend is up we can hunt for buying opportunities if Nifty does decline towards 13600-13700.
Sector Analysis: Metal Sector
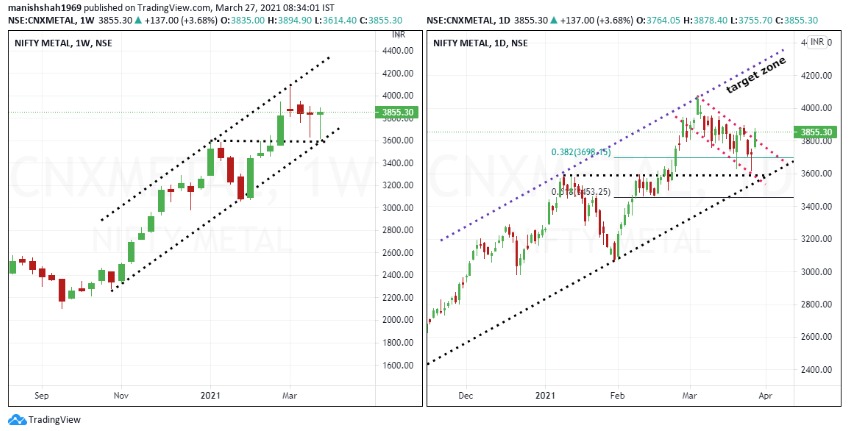
By far metals sector has been the best outperforming sector as a decline in Nifty has not damaged values in the sector index. On the accompanying chart left pane is weekly and the right pane is the daily chart.
Analysis of the weekly time frame shows a strong trend in the index with the last two weeks showing back-to-back bullish hammers at the support of the rising trend line. The pattern that emerges is that there is major support coming in from the previous swing high at 3600 (round number) and the rising trend line. This is a classic pattern of support from two diverse support concepts and this is a classic buy signal.
On the daily time frame, we see price forming a bullish Morning star at the lower end of the flag pattern. Flags are continuation patterns and denote trend continuation. We should be expecting that the CNX metals index will try to hit the upper channel line (marked out as blue) on the chart.
With metals index expected to continue higher, it makes sense to pick out stocks in the metal sector.
Investors, as well as traders, should have a portfolio of metal stocks in their portfolio. Our value pick is Hindalco, which on the weekly time frame (left pane) is in a strong trend as shown by the directional movement index. The ADX is above 30 and +DMI shows a pattern of higher highs and it is above –DMI. A bullish long bottoming tail pattern is a sign of buyers entering the market after a small decline. A small-bodied candle on declining volume does suggest that the stock is in a firm bull grip.
On the daily time frame price drops to 38.2 retracement zone. Also, note the synergy between two corrective swings. January decline was for 14 days and price dropped by 50 points. The current decline is in 15 days and the price has lost 55 points. The magnitude of the decline is almost the same in time and price.
A long bullish candle is a part of a bullish morning star pattern and this pattern is at 38.2 retracement zone. We feel Hindalco should move up towards a recent high at 360 and above that to 380 over the next 8-10 weeks. This is a low-risk position trade. Consider putting stops at 300 and take care not to take an outsized position on the trade.


