By IE&M Research
The frontline equity indices are trading at their lifetime high. However the broader market is not faring well. , however, these two sectors are buzzing. Strengthen your portfolio with the following stocks from these sectors.
The frontline equity indices are trading at their lifetime high. Both Nifty and Sensex have touched new high on July 27th, 2018. The indices have reached the current level after an interval of six months. At the surface, it seems that the market has got its mojo back and is set for new records again. Nonetheless, a little bit of scratching of surface will throw a different picture. The frontline indices, though, trading at their lifetime high, many of the constituent companies of indices are trading far from their 52-week highs or the levels they touched in January 2018, when the market last touched its lifetime high. Most of the companies are trading lower than their January level. For example, Vedanta and Tata Motors have fallen by more than 30 per cent since January end. What this means is that handful of stocks have helped the indices to improve the performance of the entire market.
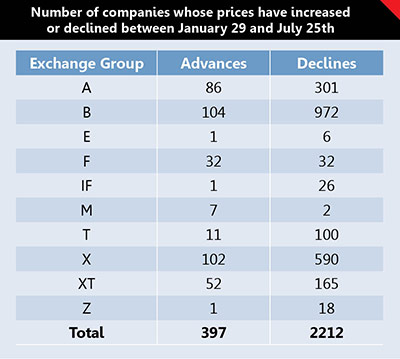
Digging deep and looking whether any such anomalies exist beyond frontline indices, we found it to be spread everywhere. In our analysis of BSE listed companies on July 25th 2018, we found that for every one company whose price has increased since January 29, there are 5.57 companies whose price are lower than January 29. Baring ‘F’ category, all other categories has seen number of company’s share prices are lower than the number of companies whose prices have increased.
This anomaly is not only evident in 
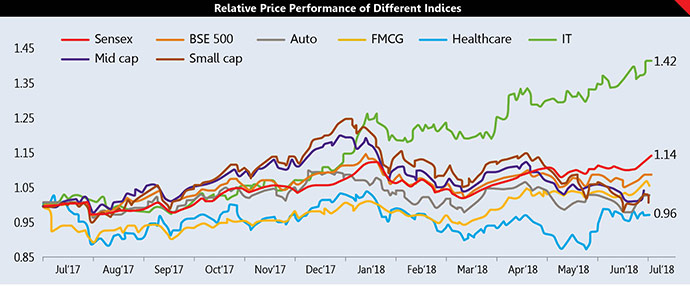
companies belonging to exchange groups but also in sectors. Study of some sectoral and broader indices of last one year shows that how couple of sectors are leading the pack. There is only one sectoral index that has beaten the BSE Sensex in last one year that is IT. Rest all that we studied are trading lower than the Sensex.
What is also evident from the relative price performance chart is that, though, Healthcare sector has underperformed in last one year, its performance has significantly improved in last one month.
One of the reasons for such improvement in those two indices is fall in the external value of rupee and strong growth in US market. Most of the IT and Pharmaceutical companies share their maximum revenue from this market. Add to that the depreciating rupee that arguers well for these companies going forward.
In the following paragraphs we will dive deep to understand what the reasons for such growth in these companies are and is it going to be sustainable going ahead.
Pharmaceutical Sector
Out of the net
Pharmaceutical remained one of the worst 
performing sectors in last one year. It was plagued by multiple headwinds and expensive valuation. The companies in the sector were hit due to huge price erosion at their largest market in USA. Besides slower pipeline monetisation and regulatory compliance overhang were the primary reasons for such bad performance of the sector on the bourses. Domestically also the operation of the companies was hit due to disruption caused by implementation of Goods and Services Tax (GST).
Nonetheless, in last couple of months, situation has changed for good for the healthcare companies and it is clearly reflected in the performance of the BSE Healthcare Index, which is up by more than 10% in same duration. The outlook for the domestic Indian markets is looking bright with sales growth expected to be in the low double digits, rebounding from GST led disruption. In US market, companies are witnessing that price erosion has stabilised. Moreover, in the recent past the USFDA approval rate rebounded to 198 nods after a temporary hiatus in Q4FY18 when the total approvals were 109. On the regulatory front, favourable inspections at Cadila, Dr. Reddy’s (Medak, Srikakulam SEZ, UK), and Sun Pharma (Halol) shows that the worst in terms of regulatory issues is over. We believe, going forward, ‘achche din’ for pharma companies will return as there is a shortage of drugs in US and USFDA is trying hard to narrow it and is even considering about incentivization of generic companies to invest more in capacity addition.
This is positive for the Indian pharma industry as we have the highest number of USFDA approved drug manufacturing plants outside the US. Indian generic companies have established a strong logistics network and also sell lot of off-patent drugs as well as biosimilars. This is reflected in the number of approvals that India got. Indian pharma companies in year 2017 received final approvals for 304 abbreviated new drug applications (ANDAs) out of the total 846 given globally — accounting for almost 36 per cent of the overall approvals. The year 2018 is also going to be another great year, looking at the pace with which Indian companies are being given approvals.
Cadila Healthcare, for example, received eight final approvals in July alone. Again, Sun Pharmaceuticals received its first product approval for the Halol site (in Gujarat) in July, after five years. The number of final approvals from USFDA in January-Jun 2018 reached to 58. According to some analysts the second half of the year is going to be better than the first half as most companies were ready with a robust pipeline of drug fillings.
Therefore, we believe that this will be one of the best sectors to invest in for next couple of years.
Cadila Healthcare Ltd.
BSE/NSE Code 532321/ CADILAHC; Face Value Rs 1; CMP Rs 378
52wk H/L (Rs) 550.20 – 333.35; Marketcap Rs 39148
Cadila Healthcare is Ahmedabad based global pharmaceutical company with strong presence in formulations and APIs. Company is yet to come out with its Q1FY19 earnings, however, Cadila’s Q4FY18 revenue increased significantly by 31% YoY to Rs 3250 crore. Gross margin too improved by 410 basis points to 66.7%. Profit margin too increased significantly due to fall in the employee cost and improvement in gross margins. While most of the pharma companies are facing pressure in the US because of issues related to pricing and USFDA, Cadila, however, has not been much impacted because of its diversified market—just 40% of its revenue come from US. Cadila has also been quick to take action on the USFDA warnings. For instance, it resolved the issues raised by the USFDA about its facility at Moraiya, Ahmedabad, much faster compared to the time taken by most Indian pharma firms. The company has strong pipeline of products in the US market. It has more than 130 pending ANDA. Cadila expects to launch around 10 products per quarter. Due to the expected launches of some key drugs, such as gToprol, gPrevacid ODT, generic version of Asacol HD and Exelon Patch, Cadila’s sales momentum in the US should continue in 2018-19 as well. Strong launch momentum, coupled with limited competition launches, should drive the US business going forward. Domestic formulations that account for approximately 28% of over all sales also saw a growth of 5% on yearly basis.
Alkem Laboratories Ltd.
BSE/NSE Code 539523/ ALKEM; Face Value Rs 2; CMP Rs 2151
52wk H/L (Rs) 2,468 – 1,578; Marketcap Rs 25997
Alkem is a Mumbai based, leading pharmaceutical company with global operations, engaged in the development, manufacture and sale of pharmaceutical and nutraceutical products. With a portfolio of more than 700 brands, Alkem is ranked fifth largest pharmaceutical company in India in terms of domestic sales. Alkem, in FY18, derived 71% revenue from domestic market, 22% from the US and rest from other markets. It is a leader in the domestic anti-infective market. Recently it has forayed in OTC market and sells Tiger Balm, Playgard (male contractive) and Pregakem (pregnancy detection kit). Company is expected to commence its Sikkim facility which would boost profitability due to tax benefits. Company’s higher domestic base offers lower regulatory risk.
Company’s domestic business saw healthy growth in 4QFY18 on the back of new product launches, increasing MR productivity and growth in chronic segment. Company maintained its domestic growth guidance of mid-teens for FY19. Growth in domestic business was also led by growth across all therapy portfolio of Alkem. Company improved its market share and rankings in chronic therapy areas of Cardiac, Anti-diabetes, Neuro and company’s every product outperformed the market growth.
Going forward contribution of US business is expected to increase further with launches like gPradaxa, gSolodyn and gMultaq over FY18-20E. This may lead to higher margins going forward. Recently company’s Daman facility has been cleared by the USFDA in July 2018 and the stock should now re-rate from its current attractive valuation.
IT Sector
Marching ahead
The IT companies have remained the 
backbone of the performance of frontline indices in the last one year. The equity bellwether index Sensex has given a return of 15.7% in one year ending July 2018. The two major IT companies namely TCS and Infosys being part of the Sensex remained its prime mover. The market cap of these two companies increased by 47.2% in the same duration and was responsible for 38% of an increase in Sensex value. So, these two companies alone helped to gain around 6% of Sensex gain in last one year. Its not only these heavyweights that have performed, even the second-tier IT companies have performed. It is quite reflected in the performance of BSE IT Index, which is the best sectoral performer in last one year. It has increased by 42% in last one year.
The early indicators of the factors impacting the sector such as deal momentum, forex movements and vertical-specific news indicate that the sector has bottomed out and a revival in overall outlook is in the offing. Nonetheless, the depreciation in the Indian rupee against the USD will have a limited benefit to IT companies as cross currency movement will set off any gain from depreciating rupee. For example, USD has appreciated by 2.3% against GBP and 3% against EURO in the last quarter. This cross-currency movement will impact negatively to IT companies.
In Q4FY18, demand commentary has been mixed across companies. BFSI and retail verticals have been the problem areas, which along with structural shifts in the industry affected the growth of IT services companies in FY18. Nevertheless, the first quarter of FY19 has started with a good note. The industry leader, TCS’s constant currency revenue growth was the strongest over the past eleven quarters led by multiple deal wins and traction in Digital. It even delivered 3.7% constant currency growth in BFSI vertical, however, Infosys saw a 0.2% decline on quarter on quarter basis. Going ahead strong macro numbers and strong financial position of US banks are indicating on set of revival in the vertical, translation of this into positive deal momentum and subsequently into revenue growth is awaited. Therefore, we believe that IT sector will continue to grow and will deliver better performance going ahead.
Majesco Limited
BSE/NSE Code 539289/MJCO; Face Value Rs 5; CMP Rs 473
52wk H/L (Rs) 603.95 – 328.00; Marketcap Rs 1494
Majesco Ltd., incorporated in the year 2013, is a small-cap IT company. Majesco reported good set of numbers in Q4FY18 driven by cloud services that have started gaining traction from its clients owing to shifting their workloads from on-premise to cloud-based solution. This is reflected in its Q4FY18 numbers when the company’s revenue increased by 13.5% on yearly basis to Rs 216.7 crore while its cloud-based revenues increased by 87.9%. The IBM-Majesco deal has started gaining momentum with the growing pipeline and they are implementing and executing orders for tier 1 and tier 2 insurance carriers in both P&C and L&A segments. The deal has contributed approximately 10% to the overall revenue during the fourth quarter of FY18.
Further, the strong momentum in new order wins continued in the quarter, providing incremental comfort for FY19 and beyond. For FY19, the company has 12-month executable order book of USD 92.6mn, up 40% yoy. This implies that even if the company maintains the current order win pace and recognition in FY19, it would clock 15% growth in revenue. Also, its revenue visibility beyond FY19 stands at USD 127mn as of today, which is up 101%, as it is witnessing strong business shift towards large deals with 5-7 year cycle. We believe that the consistent growth over all the quarters of FY18 (CQGR of 5.8%) and significant growth in 12- month executable order book provides significant revenue visibility over FY18-20E. The healthy revenue traction culminated in a much better operating performance in FY18, as the company witnessed around 12% gains in EBIT margin from Q1FY18 to Q4FY18.
Cyient Limited
BSE/NSE Code 532175 /CYIENT; Face Value Rs 5; CMP Rs 685
52wk H/L (Rs) 887 – 475.20; Marketcap Rs 7756
Cyient Limited which was earlier known as Infotech enterprises generates 33% of its revenue from Aerospace & Defence. It works with companies like P&W, Boeing, Airbus, and Bombardier, and has a leadership position in new engine designs. After acquiring Rangsons in 2015, it was able to extend its offerings from only design – to design and manufacturing. The company is betting big on the defence segment, given strong opportunities through the Make in India initiative. During Q4FY18, it formed a 51:49 JV with BlueBird Aero Systems to manufacture, integrate, and test UAV systems under Defence Industrial License with an initial production capacity of 100 systems per year. It expects to invest USD 2 million to set up a factory in Hyderabad. Over the last few years, Cyient has acquired six companies across verticals and geographies, which helped it to enhance its capabilities and deepen its partnership with a few of its strategic clients (such as Pratt & Whitney). It has also invested in a minority stake in a start-up venture and made an IP investment through a partnership. It has set a target for itself that in next three years it will change its revenue mix to achieve 25% of revenue from solutions (5% currently). Cyient’s revenue and margin performance has been exemplary in the last few quarters, excluding the Q1 blip in margin. The company’s share is currently trading at TTM PE of 19.26, which looks attractive.


