Radico Khaitan Limited
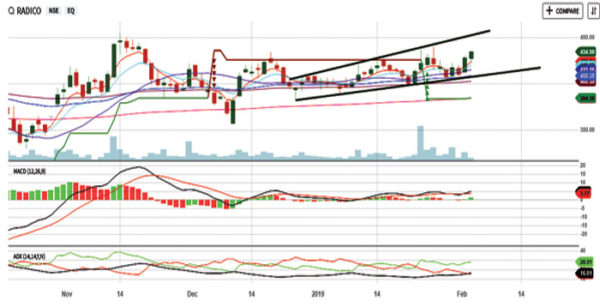
Radico Khaitan Ltd. is currently trading at Rs434 and the 52 week high/low for the stock stand at Rs499/297 respectively. The stock formed its 52 week high on 31/8/2018 from where it witnessed a correction over the next 24 sessions to Rs297. On the course of this correction, the stochastic followed by the ADX, MACD and super trend all indicated sell on weekly chart. At Rs297, the stock took support of the 26 month exponential moving average and formed its 52 week low before rebounding sharply to Rs454 over the next 24 sessions. The stock then corrected to form a significantly higher bottom at Rs356. This bottom has led the stock into a Rising Channel on weekly chart forming higher tops and bottoms. The ADX, PSAR, MACD and Stochastic are all indicating a BUY on weekly chart.

Coming to the daily chart, the stock has crossed its 5, 10, 20 Day Exponential Averages on higher daily volumes on 1/2/2019. Another factor to note is that the stock is trading above its 50, 100 and 200 day Exponential Moving Averages also. The ADX, Stochastic, MACD and super trend are indicating a buy on daily charts. Additionally, the Super trend is indicating a buy on monthly chart. We recommend buying the stock at Rs434 with targets of Rs475 and Rs499 within the next 45 and 60 sessions respectively using a stop loss of Rs403.
Avenue Supermarts Limited
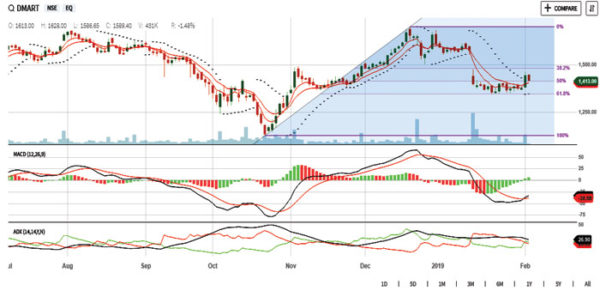
Avenue Supermarts Ltd. is currently trading at Rs1414. The 52 week high and low stand at Rs1698.70/1060.10 respectively. The stock formed its 52 week high on 19/12/2018 rising for a period of 41 sessions from its intermediate bottom of Rs1125 formed on 23/10/2018. The stock from Rs1698.70 then corrected the up move of 573 points by 61.2% over the next 22 sessions to form a bottom at Rs1343. The MACD indicated a sell on the course of the downtrend. From Rs1343 the stock bounced sharply to Rs1415 within the next 3 sessions. Thereafter the stock consolidated for an entire trading week between the two levels forming a rectangular pattern. On 1/2/2019 the stock swiftly moved out of consolidation to cross Rs1415 breaking out with highest single day volumes for the week. The MACD has indicated a buy and is supported by the ADX and PSAR. The RSI is nearing 50 levels, indicating strength in the up move. The stock has crossed the 5 and 10 Day Exponential Moving.

Coming to the weekly chart the Super trend indicator is indicating a Buy. We recommended buying the stock at Rs1414 for targets of Rs1500 and 1550 within the next 30 and 60 sessions respectively using stop loss of Rs1343.
By Sachin Shah


