


Nifty
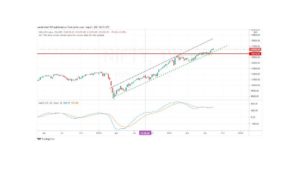
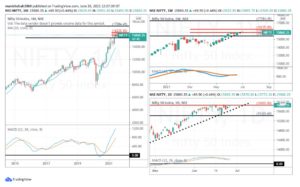
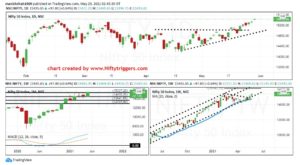
It is observed that on the weekly time (left pane) frame Nifty is in a very steady uptrend and Nifty has now declined towards the rising trend line. The rising trend line acts usually as a major support to falling prices. We also see prices getting rejected off the support of the rising trend line. In the last two weeks, we see price showing bottoming tail patterns coming right off the support of the rising trend line and the moving average. Nifty holds on to the support of the rising trend line and the moving average. The decline from the highs of February is generally on narrow ranged candles and the pattern of higher highs and higher lows is intact. The price uptrend on the weekly is intact. The decline from February 2021 is a corrective decline and mostly we are coming to an end of the corrective action.
On the daily time frame (right pane) Nifty is still in a range-bound action. The decline from the February high has five swings within it and it is taking the form of a down-sloping wedge. Down sloping wedge is a trend continuation pattern. A breakout on the upside of a down-sloping wedge is generally regarded as a bullish development. Nifty is bound in a narrow range between 14950-14250 for the last couple of weeks. The low at 14250 is thrice and this support zone at 14250 should not be violated. If it does there is a chance that Nifty will dip lower to 13750-13800. On the flip side if Nifty manages to break above 14950-15000, expect a strong trending move to emerge which will take Nifty towards 15600 and above that to 16000 and above.
The key is waiting for a confirmation and this confirmation will be on a strong close above 14950-15000. Buying on a break above 14900-15000 should be the preferred strategy.

CNX Pharma
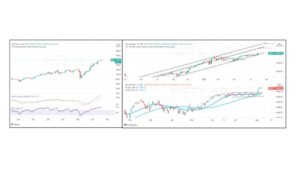
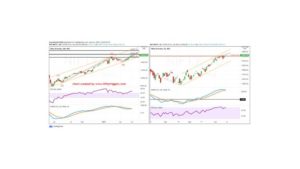
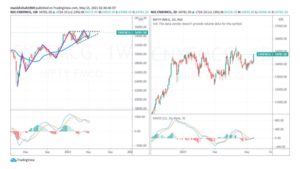
Pharma stocks are in a strong uptrend and this is seen on the weekly time frame (right pane). CNX Pharma index is marginally below the all-time high at 14010. If CNX Pharma index manages to break above the resistance at 14010 then expect Pharma stock to fly into a new orbit. A break out of an all-time high is a sign that the index is attracting a new set of buyers. On the weekly time frame, there is a strong possibility that the pharma index will break out its all-time high. In the interim, there is a resistance at 13450-13500 and if it does break above this expect further upsides to 14000-14050.
On the daily time frame (left pane) prices are in a strong trend, and if we see on the left side of the equation, notice that the price has closed above the resistance at 13060-13100. The directional movement indicator shows a strong trend emerging as the ADX value is above 25. From the weekly time frame, we know that the resistance is at 13450-13500 and there is a strong possibility of a rally towards this zone.
Currently, Nifty pharma Index is around 13200. If Nifty breaks above 14950-15000 then Pharma sector is likely to witness further buying interest. The sector is an outperformer and expects the trend to continue in this sector for at least two weeks.
The support for the CNX pharma is at 12800 and if the index dips below this level we could say that the current uptrend is questionable. Traders should use this as a gauge of where to put their stop losses.