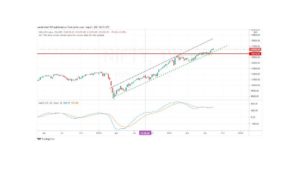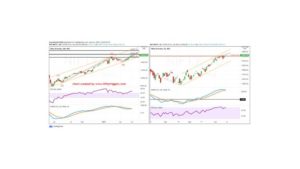


MONTHLY
We only have three days before the month of June comes to a close. So let us take a look at the structure of Nifty on the monthly (left big pane). Here we see MACD in a buy mode and price trades above the resistance at 15475. If Nifty ends the month sufficiently above 15475 we are likely to see a trend continuation towards 16500+ and above that to 17200 towards the end of the year.
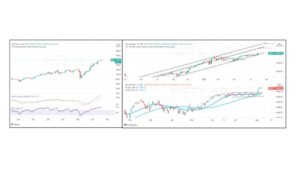
WEEKLY
Nifty closed the week with a candle that closed at the top end of the range of the week. This makes it a bullish candle (Right top pane). To an extent, this candle also overpowers the red candle of the week. On the weekly time frame, MACD has moved to a buy mode by moving above its signal line. A MACD buy signal coinciding with a long-ranged candle points out towards more upsides towards 16200-16300 within July 2021 expiry.

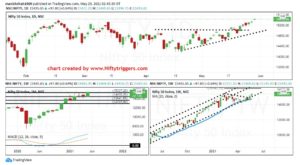
DAILY
On the daily time frame (Bottom right pane) Nifty has been trading below the resistance of 15900-15950 for the last couple of weeks. Now it seems that Nifty will start to move above this resistance level. The support trend line and rising moving averages hold at this point.
On lower time frame charts could be seeing a cup-and a handle pattern. Nifty needs to break and hold above 15900-15950 for a couple of days to confirm a breakout. With banks, IT, and metals showing active buying interest; Nifty could see an extended run on a break above 15950. Expect about of sharp up move over next two weeks.
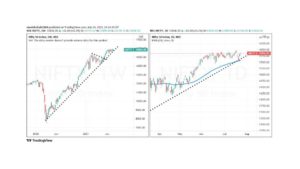
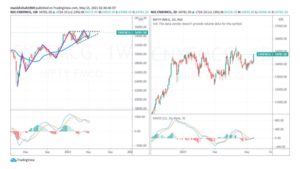
BANK NIFTY
WEEKLY
Price action on Bank Nifty on the Weekly charts (left pane) shows a wide-ranged candle closing at the high of the week. Obviously, buyers stepped into the market to push it higher. Bank Nifty is hovering around the 78.6 percent retracement of the 35260 retracements of 37708-30405 decline. MACD is in a sell mode as yet but the MACD line has hooked up. Momentum candle on the weekly time frame does suggest higher levels in the weeks to come. The index is poised to rally to 36555 and above that to 38100 over the next several weeks.

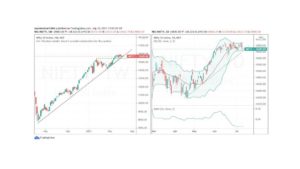
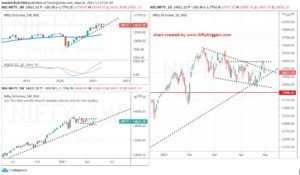
BANK NIFTY
Bank Nifty on the weekly time frame saw a close above 78.6 percent retrace as discussed above. We see a clear pattern of higher highs and higher lows confirming a change in trend.

On the daily time frame, we see series of bullish patterns from the support at 34000 which suggests higher levels. The decline from a recent high of 35810 shows a decline in AB=CD which is also a reversal pattern. A change in sentiment as indicated by these bullish patterns with a clean pattern structure of higher highs and higher lows does forecast significantly higher levels in the days to come.
Bank Nifty is on a clear-up trajectory with an exceptional risk-reward ratio trade. It is beyond the scope of this article to go deep into the nuances of the wave structure. Suffice it to say the pattern is bullish and it is reasonable to expect that Bank Nifty will rally to 38100 in the weeks to come.