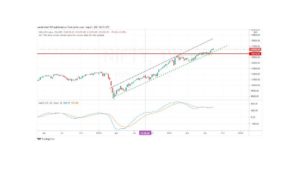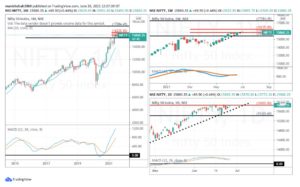


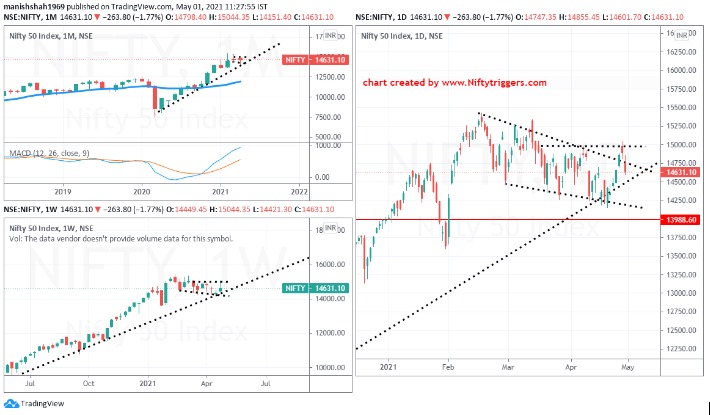


NIFTY MONTHLY TIME FRAME
On the monthly time (top left of the price chart) frame we see the index closing with a net loss of around points for the month and it is a candle with a long lower shadow. In a full-fledged pandemic, Nifty remains resilient to the onslaught made by the bears. The candle on the monthly is bullish. With MACD bullish and RSI above 60 the overall trend on the monthly time frame is bullish and eventually Nifty should resonate to trade above the February high of 15430.
NIFTY WEEKLY TIME FRAME
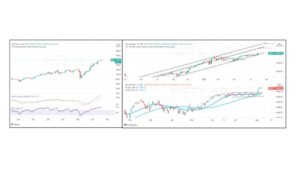
On the weekly (bottom left pane) the pattern that is seen is a green candle with a long upper shadow. Clearly, the bulls were not able to move a distance despite trying their best. On the flip side, Nifty held above the rising trendline and this is a bullish development. Also notice that in the last five weeks Nifty made three candles with long lower shadows and this is bullish. What was needed was a firm close above 15000-15050 which still remains elusive at best.
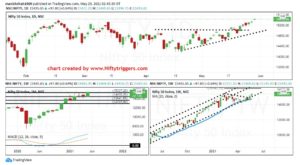
NIFTY DAILY TIME FRAME
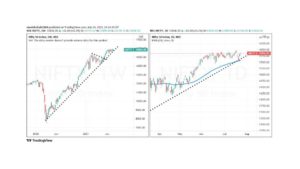
Nifty saw a break above a downsloping wedge pattern. But the barrier at 15000-15050 is resilient and Nifty was not able to breach above it.
Nifty needs to move above the resistance at 15000-15050 points and it seems that there could be some waiting before this happens. In the interim, the Nifty could remain range-bound between 15050- 14500 for some time.

On the lower side, a drop towards 14480-14300 is the support zone from where buying could be initiated with a conviction that Nifty will not trade below 13800.
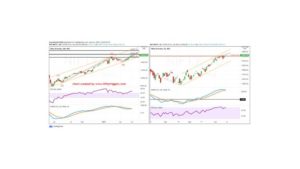
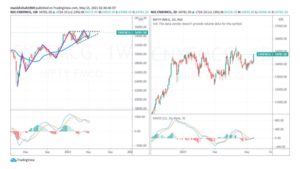
CNX PSE INDEX
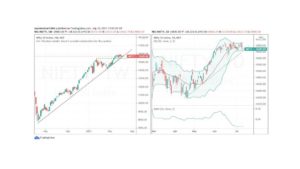
Our pick for the week is the CNX PSE index which is an index that tracks PSU stocks listed on the exchange.
On the weekly time frame (left pane) the index shows a rising trend with a pattern of higher highs and higher lows. PSE index takes support at rising trendline and we see a long bullish conviction candle that closed at the highs of the week. This is a bullish pattern.
On the daily time frame(right pane), the PSE index shows a break out of a small double bottom pattern it also registered a breakout of a falling trendline. On both time frames, the PSE index shows bullish patterns.

CNX PSE Index is likely to see a rally towards 3400 and above that to 3600 and PSU could be in limelight over the next couple of weeks. Remember the signal to buy is coming from a higher time frame and thus the holding period is to be so adjusted. As long as the PSE index holds above 3000 levels room for more upsides remains intact.