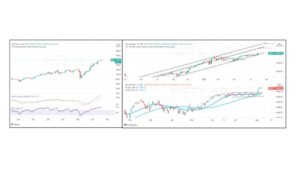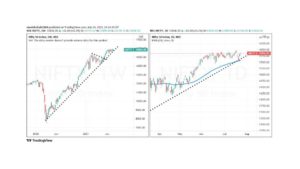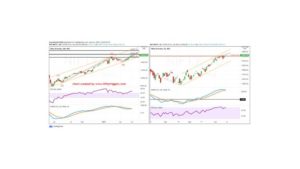


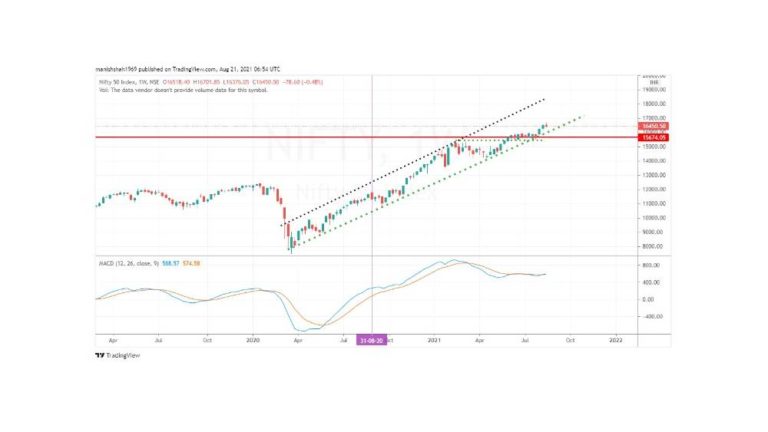


Nifty cash index
The nifty cash index continues its relentless rise. Nifty was rallied by close to 1100 points from the low at 15500 in July. The rally is in force despite the sell-off and weak market conditions in Asian markets. Nifty is an outperformer among its global peers.
The talk of fed taper is on for several months and we doubt if this factor alone will contribute to any sizeable decline in the index.
As on the weekly time frame, the price action shows Nifty made a key reversal candle. This pattern is yet to be confirmed and as such does not necessarily mean a major top. At best it could signal a range-bound movement of several weeks.
On the weekly time frame, MACD has moved into a buy mode and this is a positive development. RSI remains at an elevated level. MACD crossover when MACD is above the equilibrium is a significant development. There are times when this signal has given substantial upsides.
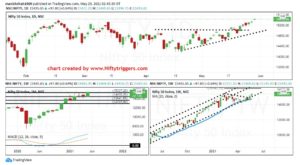
For longer-term traders who can withstand a bit of volatility Nifty does not show any major signs of a reversal. At best there could be a short-term decline towards 16150-16100. Any drop to this zone could provide buying opportunities for intermediate to long-term players.
Notwithstanding short-term declines, Nifty is in a strong uptrend on the weekly and daily. A trend strong on both time frames does point out to higher levels in the weeks to come. On the upside, we should be looking at more upsides towards 17000+ incoming 6-8 weeks.

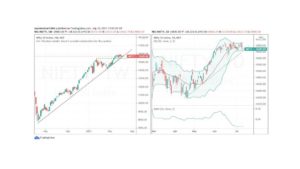
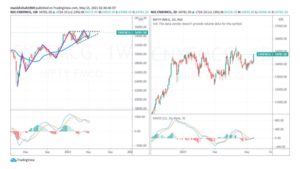
Nifty Smallcap 250 analysis
With growing concerns about the behavior of small-cap and mid-cap stocks in the last 2 weeks; we take a look at NSE NIFTY Smallcap 250 index. From the high of around 9300 Nifty smallcap index has declined by a close to 9.5 % in the last two weeks. The structure of this decline seems to be a corrective decline within an ongoing trend. In a pattern of higher highs and higher lows, counter-trend declines are considered to be buying opportunities. In this case, Nifty Smallcap Index has declined to the support of a rising trendline, a Fib retracement zone, and support of a rising moving average.
The first sign of Smallcap index bottoming out will be if the Smallcap index closes above the gap area of 8700 and a confirmed sign of a reversal will be on a break above 8900. In case Smallcap index breaks below 8300 then a further decline to 8150-8200 is not ruled out.
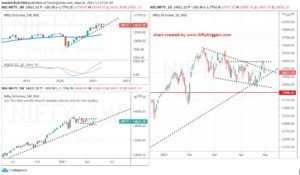
We need to put smallcap index in an observation mode and see how things pan out over the next week or so. Secondly, individual stocks will behave differently as opposed to the Index. But largely speaking, the Nifty Smallcap index is in oversold territory and it is a bad idea to sell oversold reading in a larger degree uptrend.
It is too early to call out a major top in Smallcap index as the price structure does suggest that the ongoing uptrend is still intact. We wait for reversal signals to get on board on trend reversal signals. A pop above 8700 could see the Smallcap index rallying to 9200-9100 odd levels. The rally could be fast. The biggest surprises are in direction of the trend.