


NIFTY
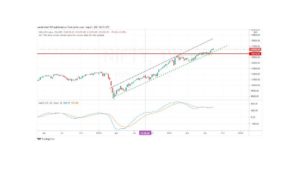
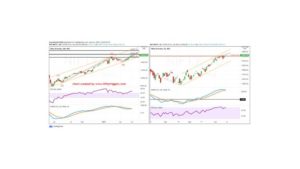
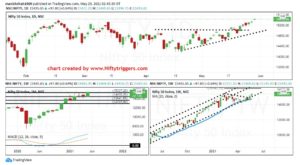
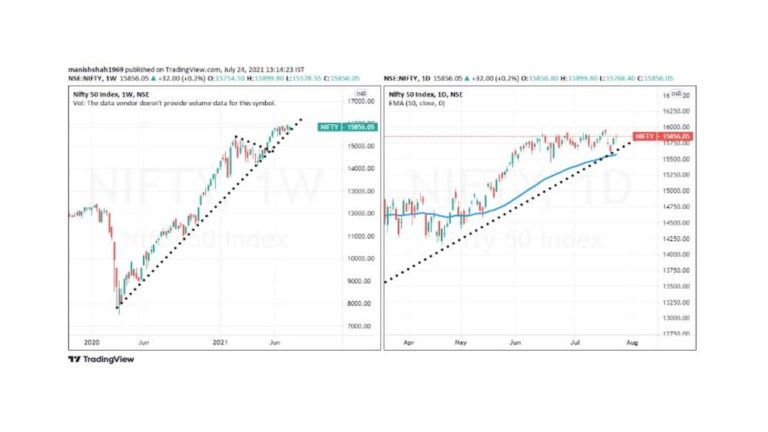
Nifty closed the week (left pane) on a flat note. The highlight of the week was the sharp bounce off the lows. All said and done Nifty remains in a range between 15600 on the lower side to 15950 on the higher side. The volatility contraction is taking longer than normal. The contraction in volatility cannot be a permanent feature. Sooner or later market should show a directional movement.
The pattern for the week is a normal ranged candle. With a longish lower shadow. The tilt is definitely on the bullish side. Nifty has tested the resistance at 15950-15900 thrice. Nifty is also taking support at the rising trendline and this trendline has held support for more than a year. At times markets do hit the rising trendline and take off vertically.
With international markets supporting the move we could see Nifty showing some positive moves on a break above 15950. Over the weekend, most equity markets especially Europe and US-traded on a firm note.
On the daily charts (right pane) Nifty has taken a pause at gap resistance at 15880-15840. A close above 15880 will be the first sign that the gap area is closed and the markets could move higher. Also, notice that the markets are taking support at the rising trendline and at the rising moving average.
Nifty is caught in a range of 15600-15950 for almost six weeks. The contraction in volatility cannot be a permanent feature. Sooner or later the spring will uncoil and we will see more upsides. As long as the support at 15500 holds we should be on the bullish side of the market.
We should be looking at the market breaking above the resistance at 15950 for a trigger to go towards 16300 and higher in the weeks to come.

NIFTY FMCG Index
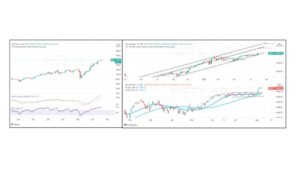
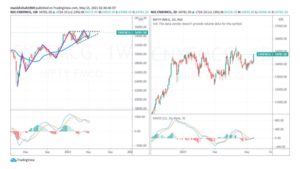
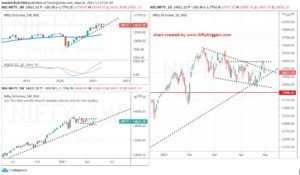
In our article dated May 15, we had given a buy-in FMCG index and since then FMCG index has managed to move from 34800 levels to 36550 levels as of date. The rally FMCG index is likely to continue and traders should focus on FMCG stocks for another couple of weeks.
On the weekly time frame (right pane) FMCG index MACD oscillator is in a buy mode and the index is caught in a trading band of 36750-35900 for more than five weeks. We then see a range expansion in the current week’s candle and this is a trend continuation signal.
On the daily time frame (right pane) the price is now moving towards 37000+ levels in the weeks to come. Price takes support at rising trendline and we see price breaking above a descending triangle pattern. This is a trend continuation signal and highlights more upside in the sector. The slope of the moving average is steadily rising and this is a sign of a strong trend.
The MACD line has been hooked up and there as long as the FMCG index holds above 36000 we will be on the long side of the sector. Stay focused on the long side in the FMCG index.